

Image Display Technology
A computer monitor is the one component of hardware that digital photography enthusiasts—whether they are amateurs, serious hobbyists, or graphic designers—interact with on a daily basis. Discussing the old debate between Liquid Crystal Displays (LCDs) and Cathode Ray Tubes (CRTs) is no longer necessary, as LCD flat-screens and modern display panels have long since become the universal standard.
Because these pages are dedicated to color and color management, the following sections will detail the specific elements of modern displays that have the biggest impact on overall color performance.
Liquid Crystal Displays (LCDs):
In general, liquid crystal displays have a structure in which their mostly planar components are assembled into a sandwich-like arrangement.
Typical parts of common TFT![]() LCD display include:
LCD display include:
- backlight illumination source
- light diffuser
- rear linear polarizer
- glass sheets with transparent electrodes and thin-film transistors (TFTs)
- layer of birefringent compensator film
- layer of liquid crystal molecules
- absorbing color filters (for fine-tuning of the spectral composition of the three primary colors)
- front polarizer
There are three main physical characteristics that affect the color performance of LCD displays:
(top)↑Backlight:
Most of the LCD displays today use a series of fluorescent lamps at the back (sometimes at the top) of the panel. Backlight fluorescent lamps (mostly CCFL![]() ) utilize inorganic salts known as phosphors
) utilize inorganic salts known as phosphors ![]() to convert the UV emission energy of mercury discharge plasma into visible part of the electromagnetic spectrum (400 nm-700 nm). Put differently, the role of the phosphors in the triphosphor blend is to generate photons with high efficiency at wavelengths near the spectral response of the human visual system. The three emission bands are centered near 450 nm (blue component), 550 nm (green component) and 610 nm (red component) - the ideal "primary colors" of the human vision.
to convert the UV emission energy of mercury discharge plasma into visible part of the electromagnetic spectrum (400 nm-700 nm). Put differently, the role of the phosphors in the triphosphor blend is to generate photons with high efficiency at wavelengths near the spectral response of the human visual system. The three emission bands are centered near 450 nm (blue component), 550 nm (green component) and 610 nm (red component) - the ideal "primary colors" of the human vision.
In the 1970's, a revolutionary blend of three phosphors (called triphosphor) emitting in the blue, green, and red spectral regions led to the development of new generations of white light fluorescent lamps which simultaneously combined markedly high color rendering with high efficacy.
On the molecular level, individual phosphors currently used in the tricolor blend of a typical fluorescent lamp are listed in Table 1. The respective emission spectrum is shown in Figure 1.
| PHOSPHOR | COLOR EMISSION | WIDTH | EMISSION PEAK (nm) |
|---|---|---|---|
| Eu2+:(Sr, Ba, Ca)5(PO4)3Cl | Blue | Broad | 450 |
| Eu2+:BaMg2Al16O27 | Blue | Broad | 450 |
| (Ce, Tb)3+:LaPO4 | Green | Narrow | 543 |
| Eu3+:Y2O3 | Red | Narrow | 611 |
Spectral purity and width of the phosphor emission lines determine color temperature and maximum gamut of a display. Color temperature of emitted light can be adjusted by changing the ratio of the three phosphor components. Figure 1 shows an example of mercury/phosphor atomic emission spectrum. Note the yellow and cyan spectral components near 580 nm and 490 nm, respectively. Such spectral "contaminations" (together with spectral characteristics of color filter pigments) cause shifts of the red and blue primaries to the center of CIE 1931 (x,y)-chromaticity diagram. This effectively means a smaller gamut. For more details on CIE system, gamut and other color management terms, see "Color and Colorimetry" sections of these pages.
Figure 1: Atomic emission line spectra of elements and phosphors
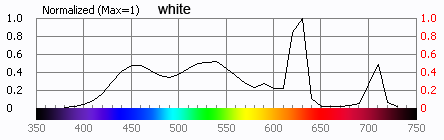
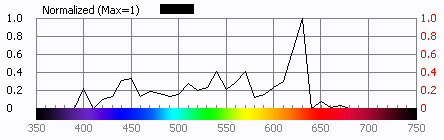
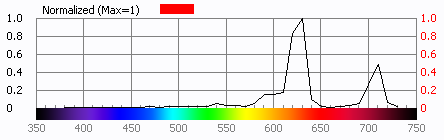
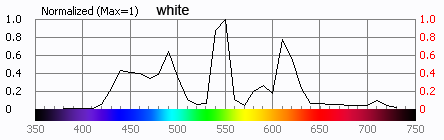
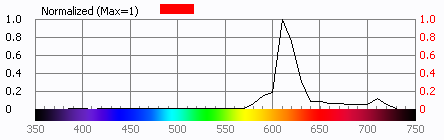
Composition of phosphors in not necessarily the same for all monitors. The following animated gifs exemplify CRT (Fig. 2) and LCD (Fig. 3) displays and their spectral radiance characteristics measured by the EyeOne Pro spectrophotometer.
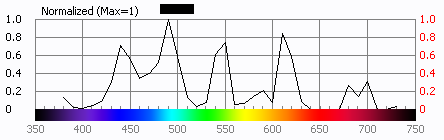
| Figure 2: Typical CRT spectral radiance distribution |
|---|
|
Unfortunately, with resolution of this device being around 10 nm, overlap of spectral peaks will occur. While wider and poorly resolved bands are observed, the qualitative differences are still easy to spot. First snapshot shows the spectral radiance distribution for a white (RGB = 255, 255, 255). It is apparent that the fluorescent lamp source has narrower line-shapes with maximum emission in green region of the spectrum. The CRT phosphors are clearly broader and the red component has two distinct peaks. Comparison of the green regions of CRT and LCD monitors (530-560 nm) would suggest extended gamut for the LCD display as the green band there is narrower.
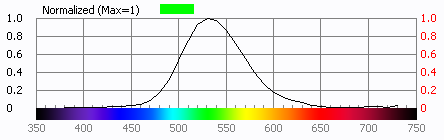
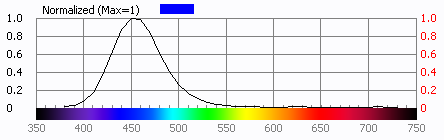
| Figure 3: Typical LCD spectral radiance distribution |
|---|
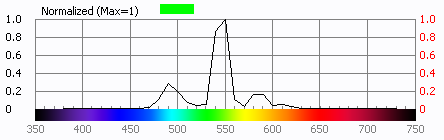
|
This is indeed the case as we will see later (Figure 4). Next frame set shows the spectral distribution at the black level (R=G=B=0). The non-zero radiances just underline the fact that there is no real black in either of the display type. The spectral distribution of the "black" is similar to that of the white, with some more energy emitted in the blue region of the spectrum. Subsequent three frames illustrate the spectral radiance distributions of the separate RGB primaries for both displays. LCD display with included broadband RGB filters features more narrow-band regions while rather large spectral widths are seen in blue and green channels of the CRT
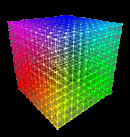
| Figure 4: L*a*b* gamuts of typical LCD and CRT displays (rotated by ~ 180o) |
|---|
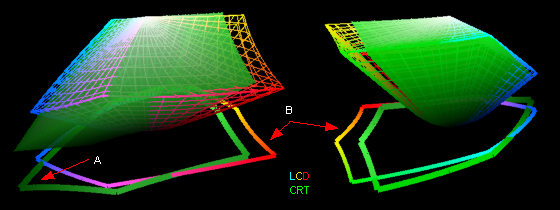 |
display. Figure 4 shows a comparison of typical gamuts of LCD (meshed) and CRT (green) monitors. While gamut volumes are about the same, the CRT has an edge in the less saturated blue-magenta areas (point A). On the other hand, the LCD has more saturated blues and red-orange-yellow areas (point B). However, due to the spectral impurities affecting both types of monitors, gamuts of CCFL based LCD displays as well as CRTs are relatively limited and close to sRGB color space (Fig. 6). Position and size of the sRGB triangle clearly shows that there are significant rendering limitations of these display devices. Particularly large are areas in the green portion of the CIE 1931 (x, y)-chromaticity diagram. It has been shown that the human visual system can distinguish between colors differing by about 1 nm in the blue-yellow region, but near the visible spectrum boundaries a 10-nm separation is required (Pointer 1998).
| Figure 5: Discrimination differences Dl(nm) in L*a*b* |
|---|
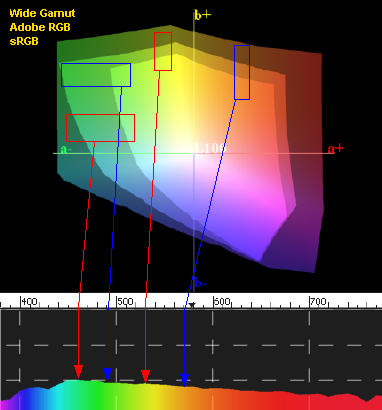 |
Figure 5 illustrates mapping between the wavelength discrimination (measured as just-noticeable differences [JND] of wavelengths) and areas of CIELAB 2-D representation of the human gamut. Two relative maxima of JND are indicated by the red lines and rectangles at 460 nm and 530 nm, respectively. These are areas where our sensitivity to changes in hue is lower. On the other hand, two relative minima are located at 490 nm and 570 nm (blue lines and rectangles). Sensitivity to hue changes in these areas is higher. It should be noted that hue discrimination depends on the luminance level (JND increases at high luminance levels), surround, and the way we observe the changes Wyszecki p.570.
Size of the gamut and the extent to what a typical LCD monitor differs from the standard sRGB gamut are shown in the CIE 1931 (x, y)-chromaticity diagrams (Figure 6). In this case, the Eizo CG19 monitor was calibrated with the Eye1 Pro spectrophotometer. Eizo's Color Navigator (top image) and its gamut boundaries were compared with GretagMacbeth's iMatch3 (toggle images by pointing your mouse over the image). 3-D gamut volumes for both
| Figure 6: Gamuts of typical LCD vs. sRGB |
|---|
| (place mouse over to toggle) |
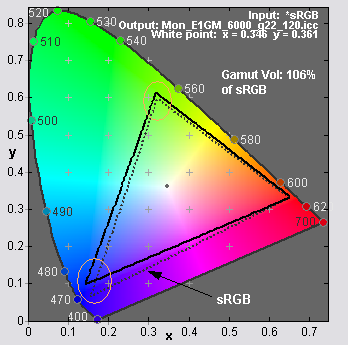 |
profiles are about 106% of the sRGB color space. In both cases, the area of displayed colors extends toward the cyan-green region outside of the sRGB gamut. At the same time, magenta and saturated darker blues are slightly compromised when compared to the sRGB gamut. Nearly identical gamut and spectral data for the Eizo CG19 monitor were obtained by Hoffmann p.36. Recently, LCD monitors having backlight lamps with improved phosphors appeared on the market (e.g. Samsung SyncMaster 931C or 226CW). Gamut of those monitors extends far beyond the limits of the standard sRGB color space - more towards green tones by sacrificing some yellow. Red and blue primaries stay about the same. To increase the display gamut to e.g., Adobe RGB color space, new types of phosphors or much purer and narrower RGB light sources are required.
The emergence of light emitting diodes (LEDs) bright enough to backlight LCD displays already shows significant enhancements in color saturation which translates into wider gamut. At this time, Eizo (CG220 line), NEC (SpectraView 2690wuxi), Samsung (SyncMaster XL20) and others already commercialize higher end wide gamut (Adobe RGB, NTSC) LCD displays. Read more about LED backlighting of LCD panels.
Last point in this section is a brief discussion on the lightness homogeneity. The white diffusion panel behind the LCD layer redirects and scatters the light evenly to ensure uniform display properties. Imperfections in design of diffusion panels lead to uneven illumination and light seepage often seen in low and middle end LCD displays. Situation is even more challenging for the LED based light sources where fixed location of RGB emitting diodes makes it difficult to produce evenly dispersed white light. That is why an uneven display brightness can be seen in older or less expensive displays.
(top)↑Liquid crystals:
Finally we come to the heart of the LCD display technology - liquid crystals. Simply put, liquid crystals are organic molecules that, within certain temperature range, exhibit fluid characteristics of a liquid and the molecular orientation order of solid states. In terms of shape, liquid crystals usually consist of "rod-like" molecules which tend to align themselves with the applied electrical field. There has been a considerable progress made over the past 30 years in the development of low-molecular-weight liquid crystals. In typical LCDs today, liquid crystals are present in a form of a 5-6 μm thick film in amounts of only 0.5-0.6 ug of liquid crystals per square centimeter (0.5 mg in a 19-inch monitor). In order to attain optimal performance of any LCD screen, liquid crystal materials have to meet certain physico-chemical properties. These include optimal nematic phase range (-40o to 100oC), clearing point,![]() dielectric anisotropy,
dielectric anisotropy, ![]() birefringency
birefringency ![]() , rotational viscosity (proportional to the switching time), and three elastic constants.
Dielectric anisotropy, Δe, is very critical parameter in design of new liquid crystals. It is correlated to the square of the dipole moment
, rotational viscosity (proportional to the switching time), and three elastic constants.
Dielectric anisotropy, Δe, is very critical parameter in design of new liquid crystals. It is correlated to the square of the dipole moment![]() - a directional quantity that can be predicted computationally. Depending on the molecular structure, Δe can be positive (dipole is parallel to the long axis) or negative (dipole is perpendicular to the long axis of the molecule).
- a directional quantity that can be predicted computationally. Depending on the molecular structure, Δe can be positive (dipole is parallel to the long axis) or negative (dipole is perpendicular to the long axis of the molecule).
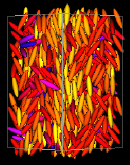
Depending on the spatial orientation, liquid crystals can be nematic, smectic or cholesteric.
-
The nematic liquid crystal phase is characterized by molecules that have no positional order but tend to point in the same direction along the director
 (Fig. 7, 8 ).
 - In the smectic state, the molecules maintain the general orientational order of nematics, but also tend to align themselves in layers or planes.
- The cholesteric (or chiral nematic) liquid crystal phase is typically composed of nematic molecules containing a chiral center. This leads to the formation of optically active helical structures which can be visualized as a stack of very thin 2-D nematic-like layers with the director in each layer rotated with respect to those above and below.
Nematic liquid crystals are commonly found in LCD displays and their molecular orientation (and hence the optical properties) can be controlled with applied electric fields.
| Figure 7: Twisted Nematic LCD cell |
|---|
 |
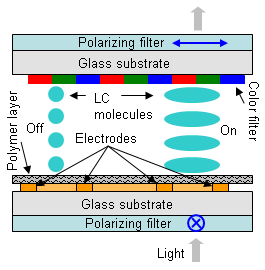
Figure 7 illustrates the principle behind the typical twisted nematic (TN) liquid crystal display. A display using active matrix TFT technology (most of today's displays) is an LCD that has a separate and independent transistor for each RGB subpixel on the display. Having a transistor at each subpixel means that the current that triggers pixel illumination can be smaller and therefore it may be switched on and off more quickly. The main components (as mentioned above) are the glass substrate covered by a transparent indium-tin oxide (ITO) electrode layer, polarizing filters, birefringent compensator films, and color filters. In a TN-LCD type, liquid crystals form a 90-degree twisted helix sandwiched between two polarizing filters (a and b). The orientation of the liquid crystals is achieved by an alignment layer of directionally rubbed polyimine layer just above electrodes. Unpolarized light from the backlight fluorescent lamp is plane polarized by the rear polarizer a. When no voltage is applied (off-state), the light passes as the liquid crystals rotate the polarization plane to match polarization plane of the lower filter (left drawing); when a voltage is applied, helical arrangement of LCs is disrupted, light is absorbed by the front polarizer b (hence effectively blocked) and the screen appears black (right drawing). Also, in the off-state, the angle between the longer molecular axis and the plane of alignment layer varies with intracellular distance. This results in a narrow viewing angle. Effect of on/off switching of LCD crystals is similar to the opposite rotation of two elements of any circular polarizing filter. In this case though, it is the polarizing planes (such as a and b) that change to cause darkening or lightening of the image seen through it.
Now, back to the color. Inside the plates are transparent electrodes (ITO) and color filters, which form very small picture element regions called subpixels. A grouping of red, green and blue subpixels defines the composite color that the pixel transmits. There is only a limited variety of dyes and pigments compatible with LCD technology. Thus spectral transmission can only be tweaked up to certain limits by changing thickness and dye concentration of the color filter.
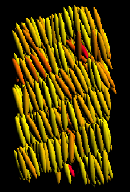
| Figure 8: Typical Nematic Liquid Crystals |
|---|
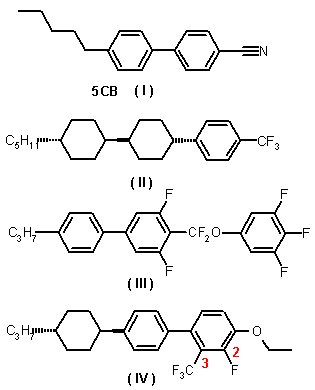 |
Presence of the permanent dipole moment is the prerequisite for nematic liquid crystals to be twisted in an electric field. Such permanent dipole moment is created when electron withdrawing groups (such as the nitrile [-CN] or trifluoromethyl [-CF3]) become part of the molecule and polarize electron density in direction of their attachment.
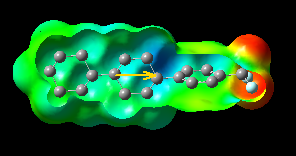
In Figure 8, chemical structures of the most typical molecules used in desktop displays are shown. Historically, 5CB ( I ) was the first member of the optically and chemically stable cyanobiphenyls introduced on the market (discovered in 1973). It has been one of the most applicable family of liquid crystals. Since the early 1980s, new class of liquid crystals containing carbon-fluorine bonds has been used in TN-TFT-LCD displays. To maintain the strong dielectric anisotropy, perfluoroalkyl chains had to be incorporated in those molecules to compensate for removal of the nitrile group (e.g. II). Basis of so called in-plane switching panels (IPS) is the molecular reorientation that takes place in a plane parallel to the glass substrates (see below). Since higher Δe is needed to compensate for larger electrode distance (intrinsic feature of this technology), IPS-based displays use molecules of type III. Recently, LCDs based on dielectrically negative liquid crystals were introduced to the market. Placing fluorine substituents at positions 2- and 3- of the aromatic ring leads to cancellation of the dipole moment component in the direction of the long molecular axis (IV).
| Figure 9: Electronic Structures of Nematic | Liquid Crystals II and IV |
|---|---|
 |
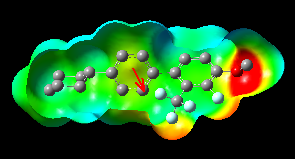 |
This causes molecules to orient perpendicular to the applied electric field (as opposed to the parallel orientation when Δe is positive). The corresponding LCD panels feature high contrast and wide viewing angle. Computer generated models of core substructures of fluorinated molecules (II and IV) with electrostatic potential (ESP) encoded on the molecule's electron density surface are shown in Figure 9. Red areas represent a negative electrostatic potential (increased electron density) and blue represents a positive ESP. Orientation and size of the molecular dipole moment can be easily predicted even low level theoretical models. Note the orthogonal direction of the dipole moment vectors for dielectrically positive (II) and dielectrically negative (IV) molecules. Arrows point to direction of increased electron density. Such molecules can be easily and quickly manipulated in fast switching electric fields.
(top)↑IPS technology:
The IPS (In-Plane Switching) technology was developed by Hitachi in 1996 to address two limitations of TN-matrices: small viewing angles and low-quality color reproduction. The name comes from the crystals in the cells of the IPS panel lying always in the same plane and being always parallel to the panel's plane (Figure 10). When voltage is applied to a cell, the crystals of that cell all make a 90-degrees turn.
| Figure 10: Composition of an IPS LCD |
|---|
| cell in LCD |
 |
In this arrangement, an IPS panel lets the backlight pass through in its active state and shutters it in its passive state (when no voltage is applied), so if a thin-film transistor breaks, the corresponding "dead" pixel will always remain black (unlike with TN matrices). IPS matrices differ from TN ones not only in the spatial arrangement of the crystals, but also in the placement of the electrodes - both electrodes are on one wafer and take more space than electrodes of TN matrices. This unfortunately leads to a lower contrast and brightness of the matrix.
Over the years, the original IPS technology evolved into several significant improvements: Super-IPS (S-IPS), Dual Domain IPS (DD-IPS), and Advanced Coplanar Electrode (ACE). The IPS technology has always been better than TN+Film in terms of color reproduction and viewing angles. S-IPS matrices have soft and pleasant colors, which are natural and close to high-quality CRT monitors. That's why nearly all LCD monitors for professional work with color are based on S-IPS matrices. They range from relatively inexpensive to hi-end models of the Eizo ColorEdge series with integrated tools for custom hardware color-calibration. The viewing angles are excellent. Unfortunately, there is one specific weakness - when looking at the screen from a side, shadows have a characteristic violet hue. The only real limitation of the S-IPS technology is relatively low contrast ratio.
(top)↑Brightness and Contrast:
Brightness refers to the luminance of white color emitted on screen and is measured in candela per square meter (cd/m2 - same as the older unit "nit"). The higher the numbers are, the brighter the screen will be. Contrast (or better contrast ratio) is the luminance ratio (unit of 1) of white to black levels. It is expressed in the form of e.g. "400:1" and simply represents the relative brightness ratio of the "white" to "black". It is the contrast that is often cited as the "notorious" weaknesses of LCD matrices. As explained earlier, LCD matrix is passive rather than active element and as such, it can't radiate any light. Instead, it can only modulate the light that is passing through it. Due to various reasons related to the quality of polarizing panels and liquid crystals themselves, the light coming from a backlight source cannot be completely stopped. Hence some portion of the backlight will pass through the matrix causing the shadows never being black (Y > 0.3 cd/m2). The fact that a good CRT monitor provides better contrast than a good LCD monitor is the consequence of LCD matrix design principle.
| Figure 11: |
|---|
 |
Most of the LCD displays have OSD (on-screen-display) controls labeled BRIGHTNESS and CONTRAST. Note that these controls have different functions than controls (of the same name) on a CRT display! In the LCD world, the BRIGHTNESS control alters the backlight luminance effecting what in a CRT would be CONTRAST. Sometimes video card or monitor lookup tables (LUTs) are used in addition to set the desired brightness. If you read that contrast sets the overall brightness and brightness actually sets contrast then the reference is to the CRT monitors. In LCD displays, BRIGHTNESS changes both black and while levels at the same time (Fig. 11) while CONTRAST adjusts the brightness of while levels, keeping black levels unchanged (Fig. 12). Moreover, LCD displays do not have the real contrast control. Contrast is set by adjusting video signal in the video card. It should be noted that reduction in contrast reduces the display dynamic range whereas a reduction of brightness (if it is done with the lamps) does not. That’s why it is always preferable to achieve the best-looking image using the brightness setting.
| Figure 12: |
|---|
 |
(top)↑ Bits and colors:
Now, very briefly on the amazing number of colors that manufacturers advertise. Most displays today offer 256 levels of brightness per pixel (at the 8-bit rendering). Through the careful control and variation of the voltage applied, the intensity of each subpixel can range over 256 shades. Combining the subpixels produces a possible palette of 16.7 million colors (256 shades of red x 256 shades of green x 256 shades of blue). When one reads 16.2 million colors, the monitor uses 6-bit per color (64x64x64 = 262,144 colors) and perception of the remaining colors is achieved by dithering or frame rate control (FRC) technique. Dithering can simulate 253 shades for each channel, i.e., 253x253x253 = 16,194,277 simulated colors. Most color displays use frame-buffer architecture, where the image is stored in video card memory from which video controllers constantly refresh the screen. For example, a display with 1280 x 1024 pixel resolution with 8-bit per color would require (1280 x 1024 x 8 x 3)/8 = 3.9 million bytes of memory to represent the frame. For obvious cost and speed reasons, the lookup table (LUT) architecture is commonly used. One more note on the millions of colors - these millions only refer to a number of possible encodings (in 8-, 16-bit devices or images). Such a huge number far exceed the number of reproducible and perceivable colors (the human eye is able to resolve about 2.28 million discernible colors).
(top)↑Links and References:
General references:
- Wyszecki, G., Stiles, W. S., Color Science: Concepts and Methods, Quantitative Data and Formulae, Wiley-Interscience; 2nd Edition (2000).
- H.R. Kang, Computational Color Technology, SPIE Press, Bellingham, Washington USA (2006)
- M.R. Pointer, G.G. Attridge, The number of discernible colors, Color Res. Appl. 23, pp. 52-54 (1998)
- B.A. Wandell, L.D. Silverstein, Digital color reproduction, The Science of Color, pp.281-316 (2003)
- Gernot Hoffmann, Color Mathematics by PostScript (ColorCalc, SpectroCalc)
Read more on LCD technology:
- How LCDs work
- Why are LCDs so bright?
- LCD at Wikipedia
- LED Journal (many aspects of LED technology)
General :

Nematic film of liquid crystals.
Nematic liquid crystals
Smectic liquid crystals
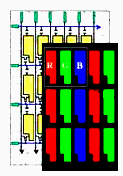
TFT array with color filters